Some of the best showcases of Mixed Reality / VR / AR include 3D visualizations of MRI (magnetic resonance imaging), CT (computer tomography) or ultrasound scans. 3D brings tremendous advantages for analyzing the scanned images compared to only viewing 2D slices. Additionally, a good visualization brings value to patients who can gain a better understanding if they can easily explore their own body.
As part of the 3D information visualization lecture at the FH St. Pölten, I’m giving an overview of the process of converting an MRI / CT / ultrasound scan into a hologram that you can view on the Microsoft HoloLens or with Google ARCore. This blog post series explains the hands-on parts, so that you can easily re-create the same results using freely available tools.
Medical Image Processing
One of the most popular software packages for medical image processing is 3D Slicer. It’s open source and free to use even for commercial scenarios. Through its extensibility with plug-ins that are easy to code (Python), it’s a great tool for research as well. However, the software is not FDA certified, and it takes a bit of time to find your way around the user interface.
![]()
In the Slicer forums, it’s often recommended to use the latest nightly build instead of the last stable version. In this tutorial, I’m also using the current nightly version of the v4.7 branch, as it includes a new and improved segmentation tool that is more powerful than in the last stable 4.6 release (which was released around a year ago).
MRI / CT / Ultrasound Data
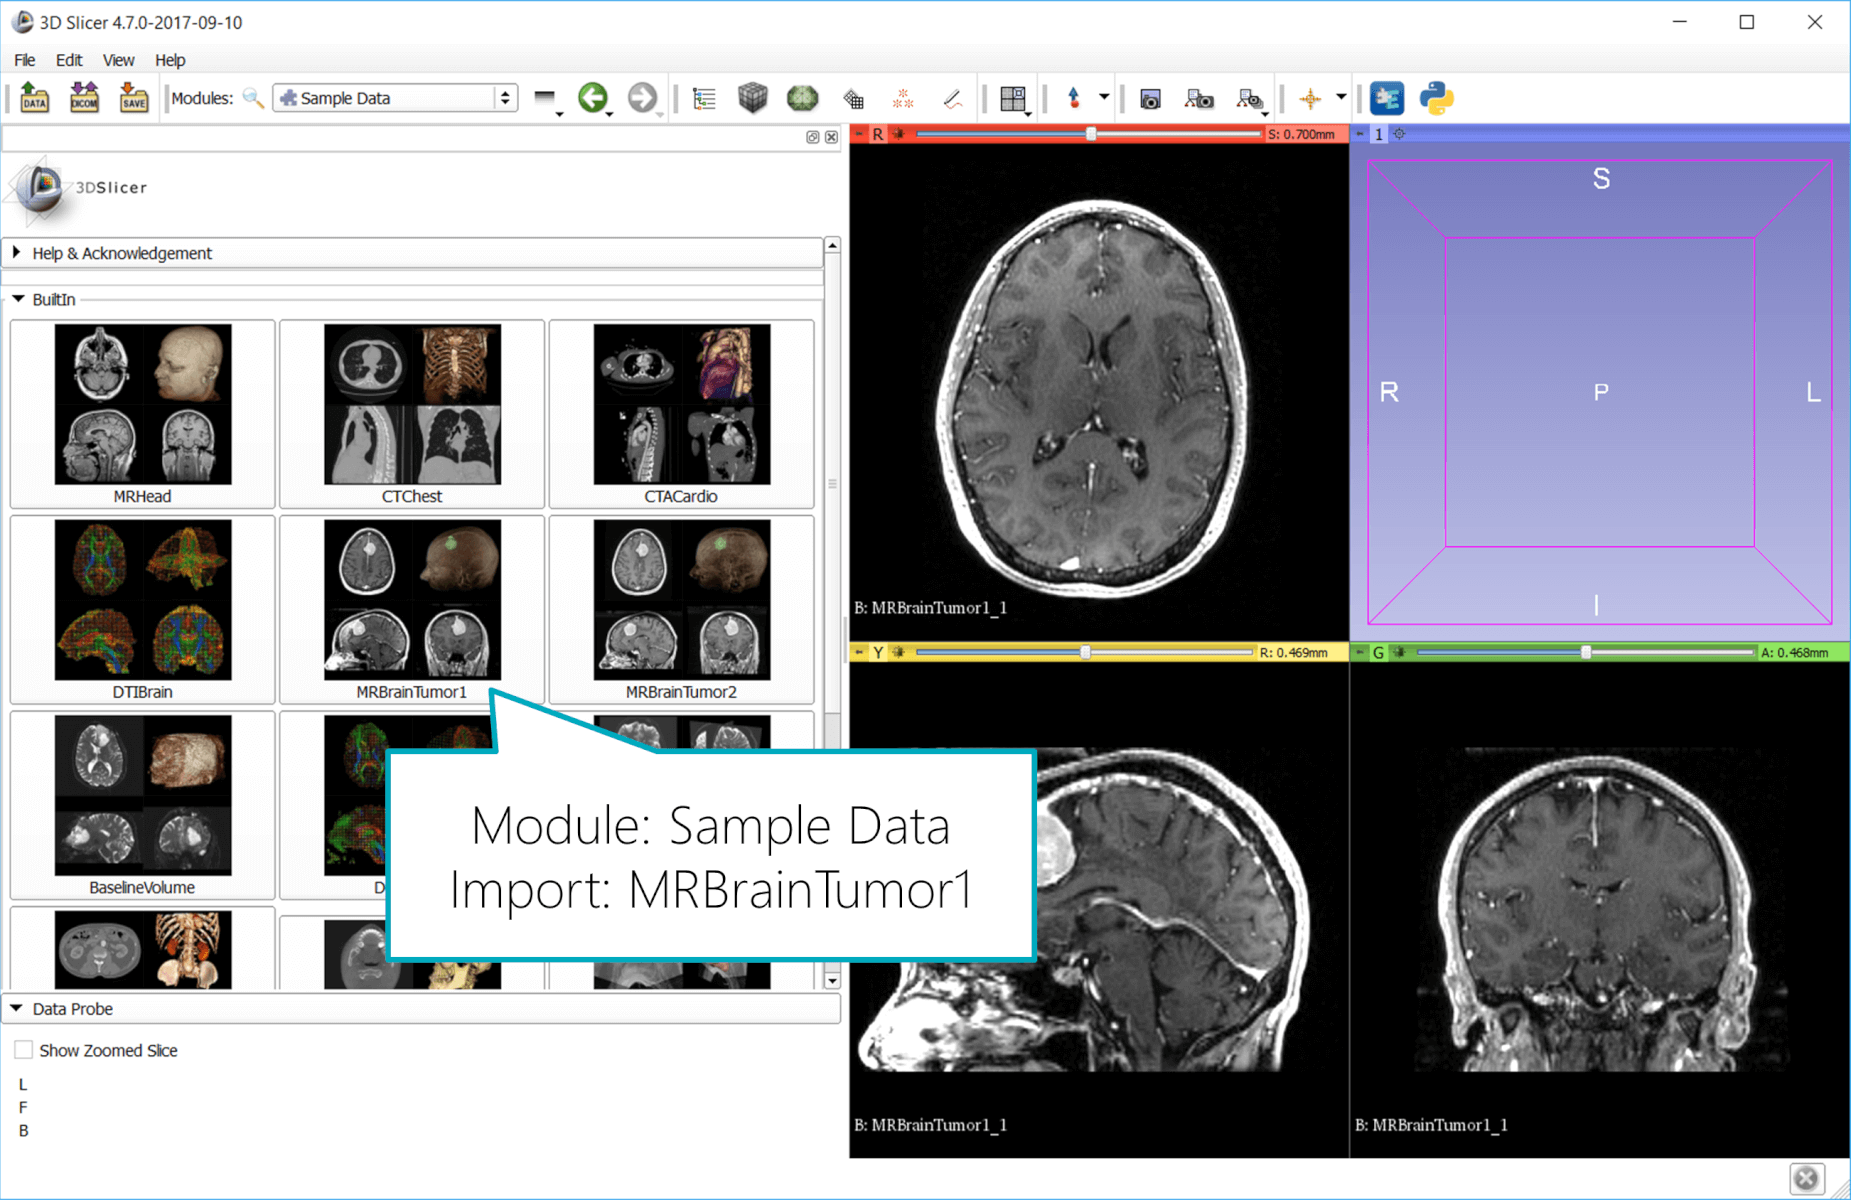
When you start 3D Slicer, you have the option to Download Sample Data. Click this if you don’t have your own image data. Import for example the MRBrainTumor1 data set.
Your Own DICOM Data
In case you can get your own MRI / CT / Ultrasound data from your hospital, you will usually get a CD with DICOM data. DICOM is short for Digital Imaging and Communications in Medicine, and it’s both a file format and a network communications protocol. The data sets stored in DICOM format contain:
- Metadata: patient ID, hospital, date, study, etc.
- Hierarchy: patient > study > series (contains 1 or more images)
- Image data: allows various formats (e.g., JPEG or lossless format that use run-length encoding)
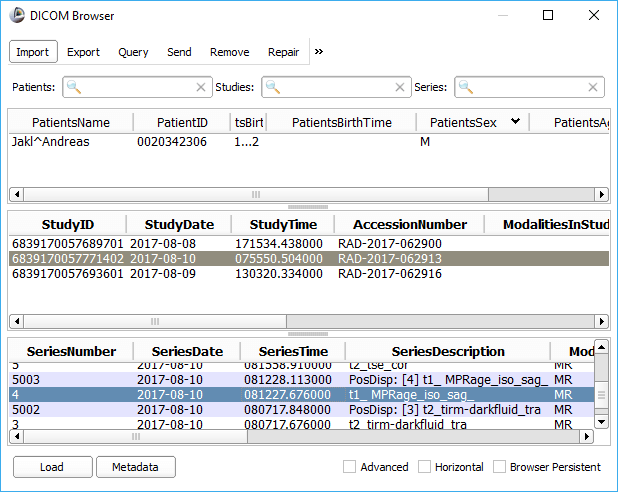
Instead of loading the sample data, load DICOM data through the DICOM module, and then select the study and series to import. In this tutorial, I’ll use my own MRI imaging data; but you will get the same results using the sample data that comes with 3D Slicer.
Anonymizing DICOM Data
If you have your own DICOM data and want / need to give it to others, be careful. The file format contains a lot of personal data that you might not want to share (information about the patient, doctor, performed study, reasons for the study, etc.).
To anonymize the data, you have two options:
- Save the images as .nnrd: The “nearly raw raster data” reduces the files to only the pixel data. While this guarantees that everything except information like text written directly into the images is removed, it also removes other information like the position of the slices, which can be useful to combine multiple series into a single visualization.
- Use an anonymizer tool: These remove most of the personally identifiable information while still retaining technical data about the performed study. Multiple such tools are available for free, e.g., DicomCleaner by PixelMed Publishing. It’s a Java tool that is open source (though not hosted on GitHub or other similar platforms).
You can also use 3D Slicer to display the DICOM metadata. In the DICOM Browser window, click on the Metadata button at the bottom to get an additional dialog showing an overview of the contained tags, attributes, and values.

Adjusting contrast and brightness
After importing MRI / CT / ultrasound data, the image might appear much too bright or dark. Depending on which area of the scan is of interest for you, you need to optimize the brightness and contrast for that region.
Like 3D modeling software, you can choose the window layout and the views you see. Very convenient for the first steps is the “Four-up” view, as it gives a good impression of the data from axial, sagittal and coronal views in similar sizes. Later when segmenting data or optimizing the 3D visualization, you can switch to different views.
Go to View > Layout > Four-Up for the default view. Use the mouse wheel in one of the three 2D views to select different slices.
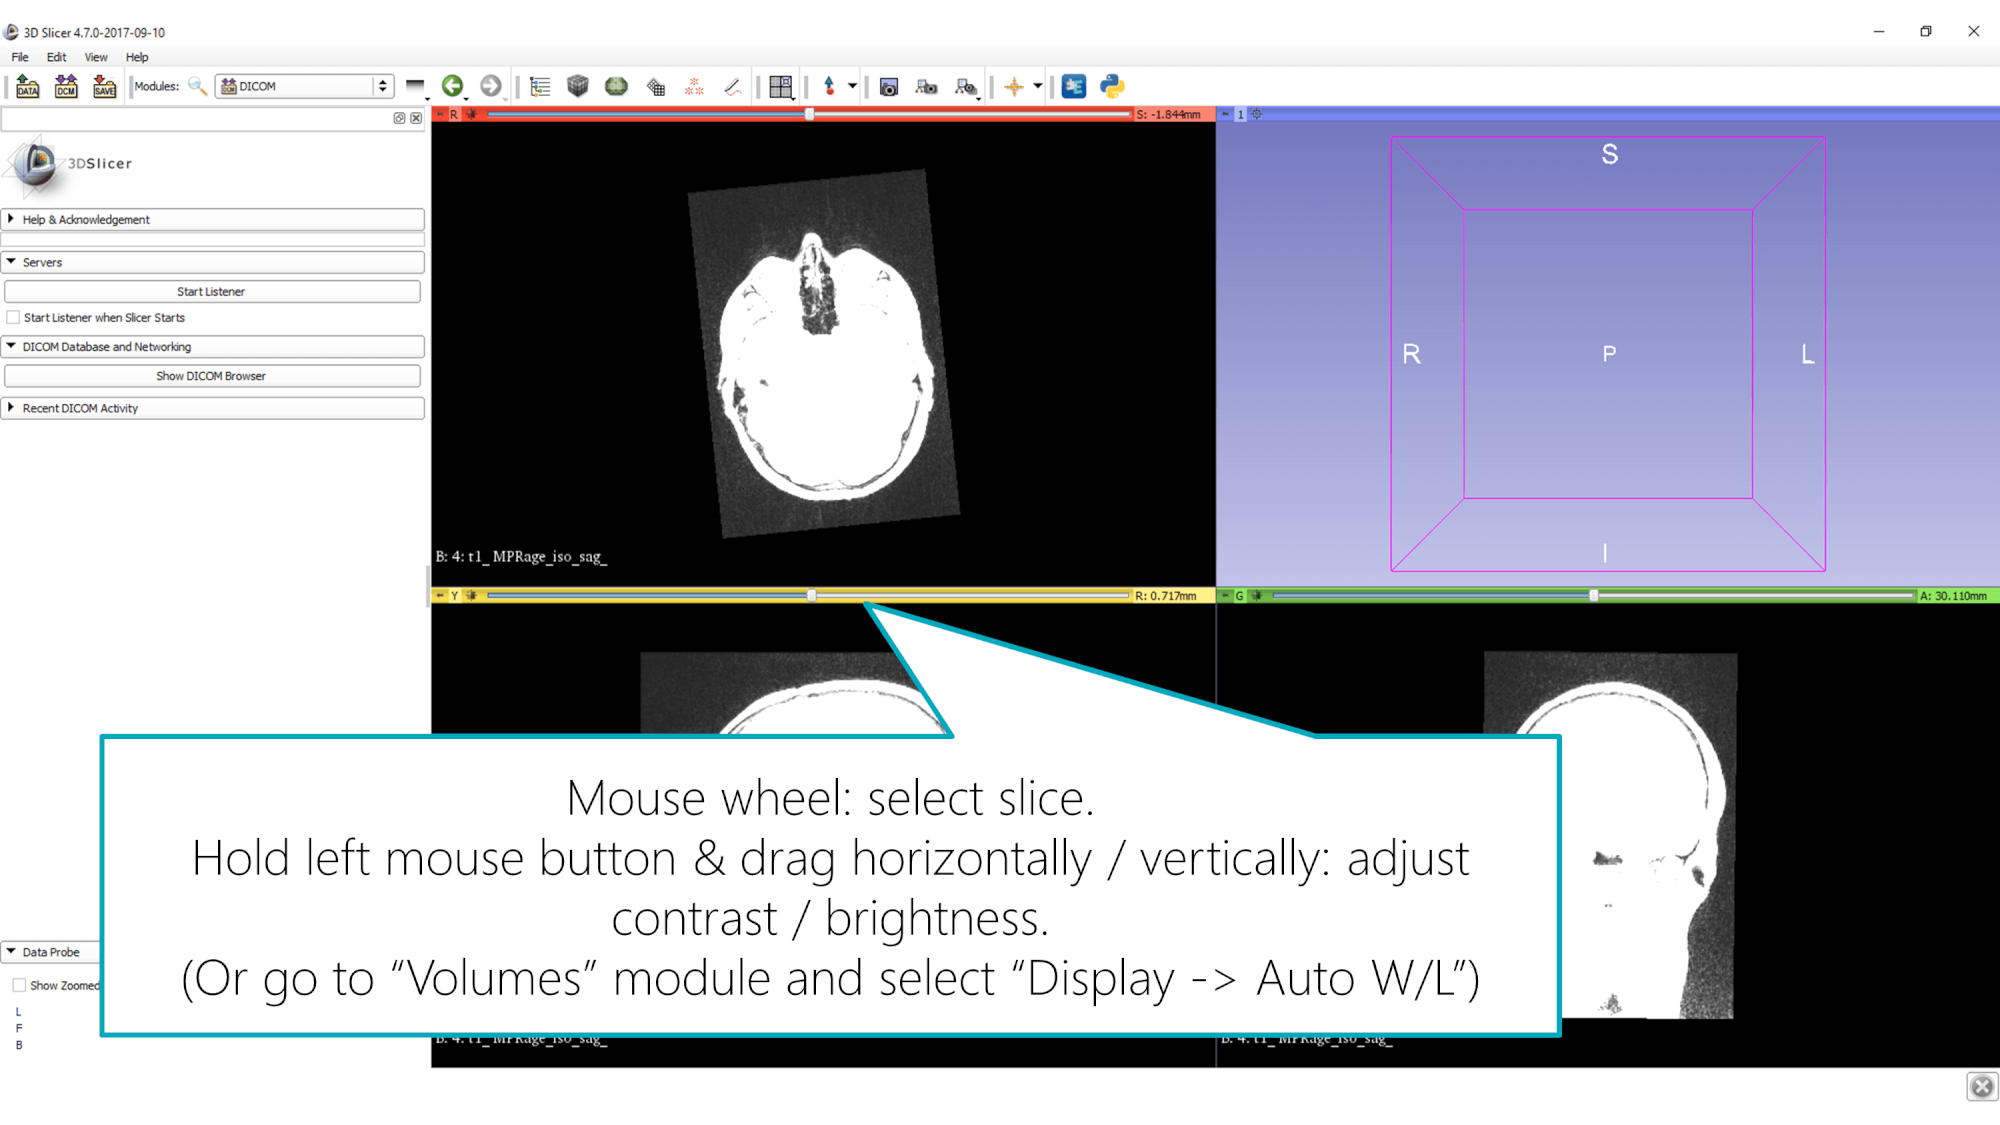 To adjust brightness and contrast, click and hold the left mouse button in one of the images and drag the mouse horizontally / vertically.
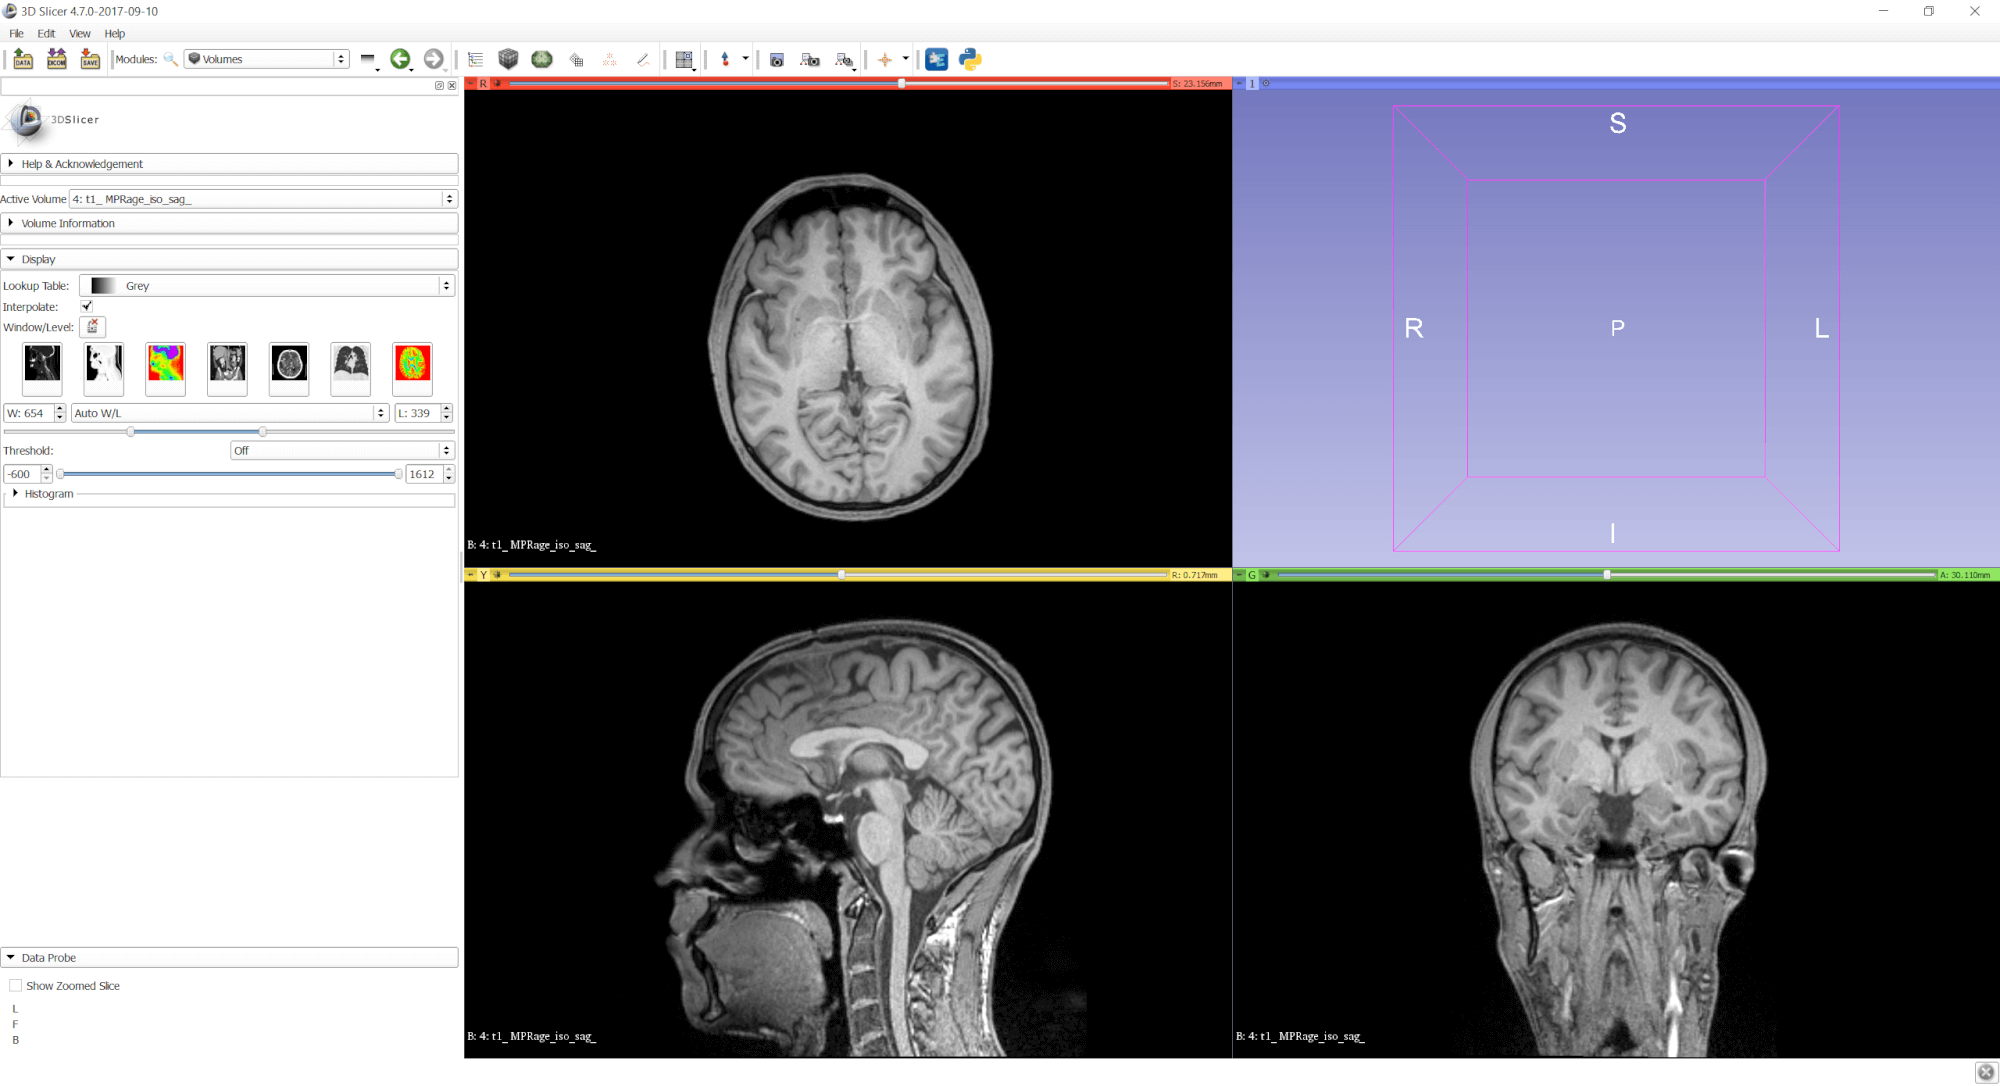
In most cases, it worked fine for me to let Slicer adjust these values automatically: go to the Volumes module through the drop-down menu in the toolbar and select Display > Auto W/L (“window level”).
This is what the final MRI scan with optimized brightness and contrast looks like:
In the next part of the blog post series, I’ll demonstrate options for 3D visualizations of the MRI / CT data that we have just imported.