Creating an Alexa-hosted skill is a fantastic way to start developing for voice assistants. However, you will eventually face issues that you need to debug in code. Alexa offers local skill debugging through Visual Studio Code but setting it up is a bit tricky. This guide will take you through the necessary steps.
Skill Environment
This guide focuses on a Python-based skill and uses Windows as a local dev environment. Most also applies to other environments.
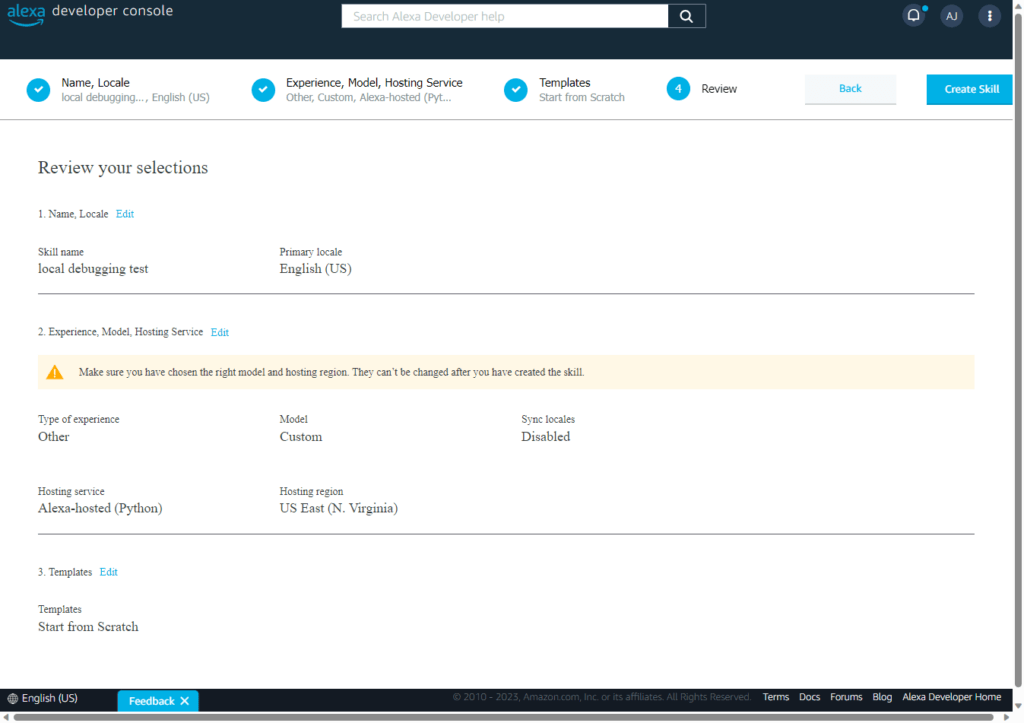
I’ll start with a blank skill. First, create the skill in the Alexa Developer Console. The skill name I’m using in this example is “local debugging test”. The “type of experience” is “Other”, with a “Custom” model, as I’d like to start with a minimal blank skill. In the “Hosting services” category, choose the “Alexa-hosted (Python)” category. In the last step about templates, stick with “Start from Scratch”, which will give you a minimal Hello World-type voice interaction. The following screenshot summarizes the settings:
Other Prerequisites
You should download and install Python, Git for Windows, and Node.js (which is still useful for the go-to Alexa Skills Kit Command Line Interface (ask-cli)). Make sure to restart Windows afterwards, as these tools need to integrate into your environment variables.
Downloading the Skill to Visual Studio Code
Next, you download a local copy of the skill. Install the Alexa Skills Toolkit for Visual Studio Code through the extensions manager.
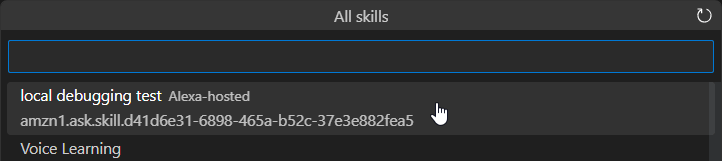
In the Alexa Skills Toolkit tab in VS Code, in the “Skills Management”-category, click on “Download and edit skill”. After you signed into your Amazon Developer account, you will see the list of all your skills in the list. Select our new “local debugging test” skill and choose any local folder to download the project content to.
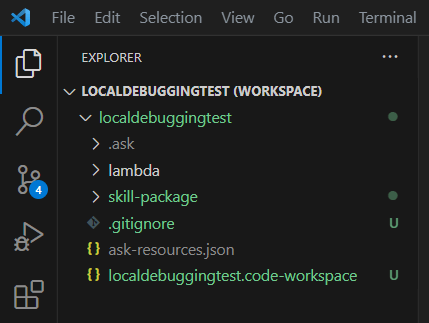
You should now see the skill downloaded with its individual sub-folders. To make saving configurations easier, save the VS Code workspace.
Working with Local and Remote Alexa Code
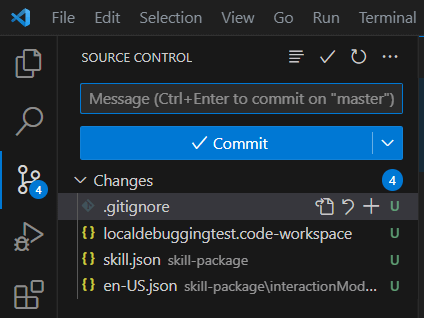
Updating your Alexa-hosted skill through Visual Studio Code works through Git source control – but only half-way. Any code changes you make will be visible in the “Source Control” tab. Commit any change you make there.
This is also already necessary now, as a few files have been updated just by downloading the skill. Click the “Commit” button after adding a message; but don’t sync / push your changes to the remote origin manually.
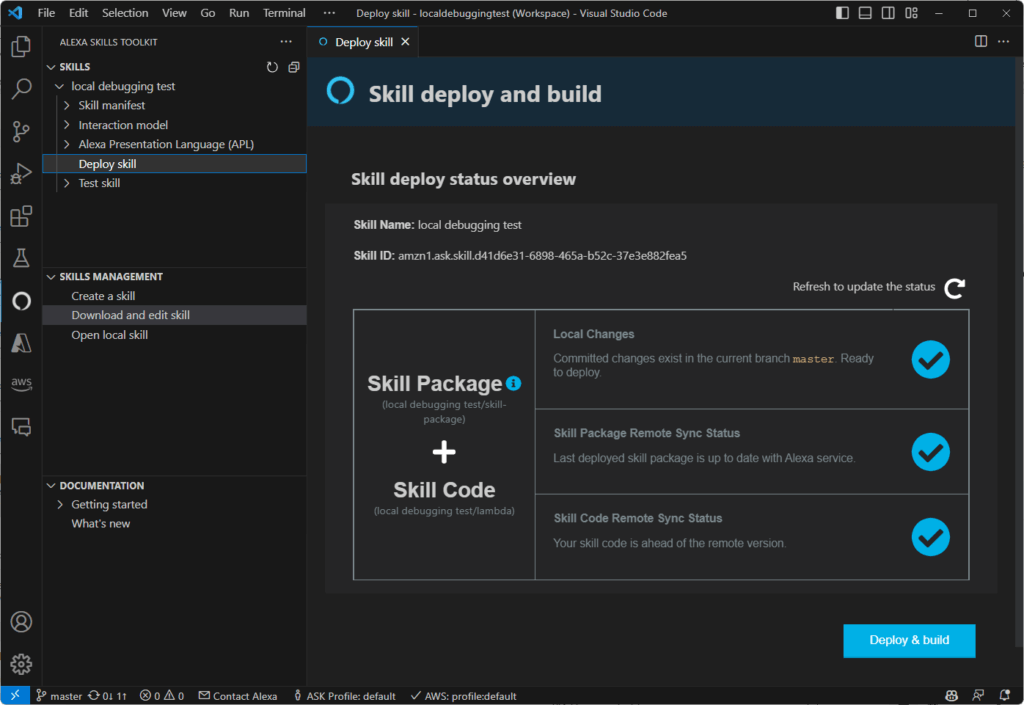
Instead, go back to the “Alexa Skills Toolkit” tab. In the “Skills” category, choose “Deploy skill”. All status checks should pass, and you can click the “Deploy & build” button to sync your changes to the remote git and trigger a skill build on the Alexa backend. Don’t worry, this will take a few minutes.
Local Debugging
Now that you confirmed that the basic interaction of your local environment with the Alexa hosted skill environment works, it’s time to enable local debugging.
Open a Terminal in Visual Studio Code. First, I’d recommend also setting up the global Alexa Skills Kit through NPM, as this is easiest to use for some commands that are not available by the VS Code extension. Install and activate it through:
npm install -g ask-cli
ask configure
The second command (ask configure) will ask you to sign into your Amazon Developer Account. The login happens through the browser. You don’t need to link your AWS account for an Alexa hosted skill; it’s OK to skip that step. For more details, see the ask-cli Github page.
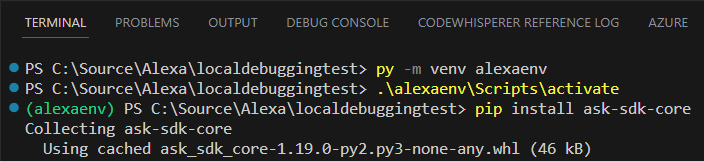
Next, we will configure the local debugger for the Python ASK SDK. The general description of the ASK SDK Local debug is available on Github. However, the description instructs you to use virtualenv; according to the Python documentation, you should use venv for Python 3 (and virtualenv for Python 2). As we’re using Python 3 and venv is pre-installed, it’s better to go with this variant. The adapted code for your terminal:
py -m venv alexaenv
.\alexaenv\Scripts\activate
pip install ask-sdk-core
pip install ask-sdk-local-debug
ask configure
What is happening here? We first create a virtual environment called alexaenv. This will create a separate folder called alexaenv in your project. You should later add this folder to your gitignore, so that it doesn’t get checked in and remains local-only.
Then, we use the command inside this environment to activate it. The following prompts will run inside your virtual environment. Even if you have already installed Python extensions outside, you will need to re-install them for your new environment. Therefore, we install both ask-sdk-core as well as ask-sdk-local-debug.
At the end, you also need to configure this local Python version of ASK to connect to your Amazon Developer account.
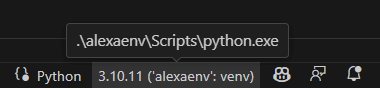
In addition, make sure that Visual Studio Code is also using your local Python environment to execute its commands. When you have a Python file open in the editor, look for the item in the lower right corner and switch to “alexaenv (venv)”.
Configuring the Debugger in Visual Studio for Alexa Skills
The official Alexa developer documentation only contains examples for Node.js. However, there are a few small issues that are specific to the Python tools and Windows that you need to be aware of. Follow these steps:
- Open the Visual Studio Code “Run” menu and choose “Add Configuration…”.
- In the “Select debugger” box, click on “Python”.
- In the following choice, click on “Python File”. This creates a run configuration file (
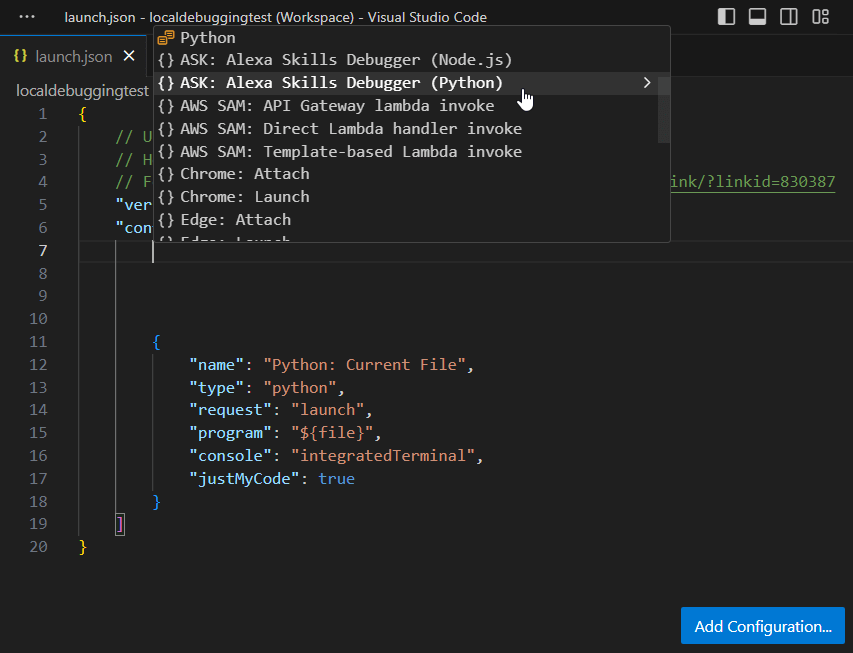
.vscode/launch.json). Note: We won’t use this config as we can’t directly run the main Python file from our skill code. - Click on “Add Configuration…” again. This time, the menu additionally contains the “ASK: Alexa Skills Debugger (Python)” item. This adds a second configuration to our
launch.jsonfile. - The last item of “args” is automatically selected, where you need to select your region.
NAis for North America,EUfor Europe,FEfor the Far East. This needs to correspond to your developer account region (not some skill setting!).
This should be it. After saving the file, you can switch to the “Run and Debug” view in Visual Studio Code and choose the “Debug Alexa Skill (Python)” configuration.
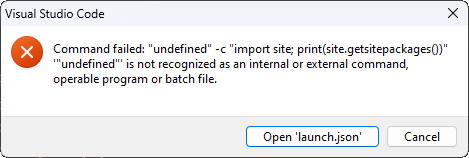
Unfortunately, this fails with the error message “Command failed: undefined”, which isn’t too helpful.
Fixing Issues with Local Debugging
Searching for this error leads to an unresolved GitHub issue in the ASK Toolkit for Visual Studio Code in connection to the Python environment. At the time of writing, caccia78 reported a workaround just a few days ago. Apparently, command:ask.debugAdapterPath is not found, possibly due to a misconfiguration in the toolkit.
The workaround is to list the absolute path. For the environment we created in this guide, it is:
"program": "${workspaceFolder}/alexaenv/Lib/site-packages/ask_sdk_local_debug/local_debugger_invoker.py",
There are two more issues you should correct. The auto-generated launch.json file has a few comment lines (with //) at the beginning. This kind of comment isn’t allowed in JSON format. Simply delete these lines. Additionally, Visual Studio Code highlights that pythonPath isn’t allowed in a launch configuration, but it was added to the “Debug Alexa Skill” configuration. It doesn’t hurt to remove that line as well. Your complete launch.json file should look like the following at the end:
{
    "version": "0.2.0",
    "configurations": [
        {
            "name": "Debug Alexa Skill (Python)",
            "type": "python",
            "request": "launch",
            "program": "${workspaceFolder}/alexaenv/Lib/site-packages/ask_sdk_local_debug/local_debugger_invoker.py",
            "args": [
                "--accessToken",
                "${command:ask.accessToken}",
                "--skillId",
                "${command:ask.skillIdFromWorkspace}",
                "--skillHandler",
                "lambda_handler",
                "--skillFilePath",
                "${workspaceFolder}/lambda/lambda_function.py",
                "--region",
                "EU"
            ],
            "console": "internalConsole",
            "cwd": "${workspaceFolder}/lambda"
        },
        {
            "name": "Python: Current File",
            "type": "python",
            "request": "launch",
            "program": "${file}",
            "console": "integratedTerminal",
            "justMyCode": true
        }
    ]
}
Python Version & File Naming
Another issue that depends on the installed environment is that some tool might have python3 hardcoded. However, the naming of the Python executable is platform-specific, which is also discussed in the Python github issue tracker. On Linux and Mac, the executable is called python3; on Windows, it’s just python (unless you install it through the Windows Store – it’s complicated 🙄).
Anyway, a simple workaround if you face this issue is to go to your ./alexaenv/Scripts/ folder and create a copy of python.exe that you then rename to python3.exe.
Discovering Local Python Files / Modules
As soon as your Python skill gets larger, you will want to split the code into multiple files. However, due to the way the skill is executed locally, you might get error messages like “Failed to load the module” or “ModuleNotFoundError: No module named xx”.
This happens even if you import your own .py files correctly. For example, you can create a separate implementation file called db_handler.py which contains a function saveToDb:
def saveToDb(data):
    print("Saving to DB")
    print(data)
    return "Saved to DB"
You then import this function into your main lambda_function.py file through:
from db_handler import saveToDb
This works fine when executed in the cloud; but not when debugging locally. You will get the following output in the Debug Console window of Visual Studio Code.
File "C:\Source\Alexa\localdebuggingtest/lambda/lambda_function.py", line 20, in <module>
    from db_handler import saveToDb
ModuleNotFoundError: No module named 'db_handler'
StackOverflow user Luis Timaná provided a valid answer with a code example that solves the problem. The positive side is that the additional code doesn’t break executing your skill in the cloud. This means that you can simply add it before you do your first import of custom files. This is the code you need to add:
import sys
import os
myDir = os.getcwd()
sys.path.append(myDir)
from pathlib import Path
path = Path(myDir)
a=str(path.parent.absolute())
sys.path.append(a)
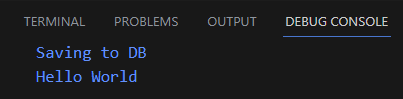
After this fix, your code executes correctly on your local computer, and you will see the following output from the print() statements in your Debug Console window:
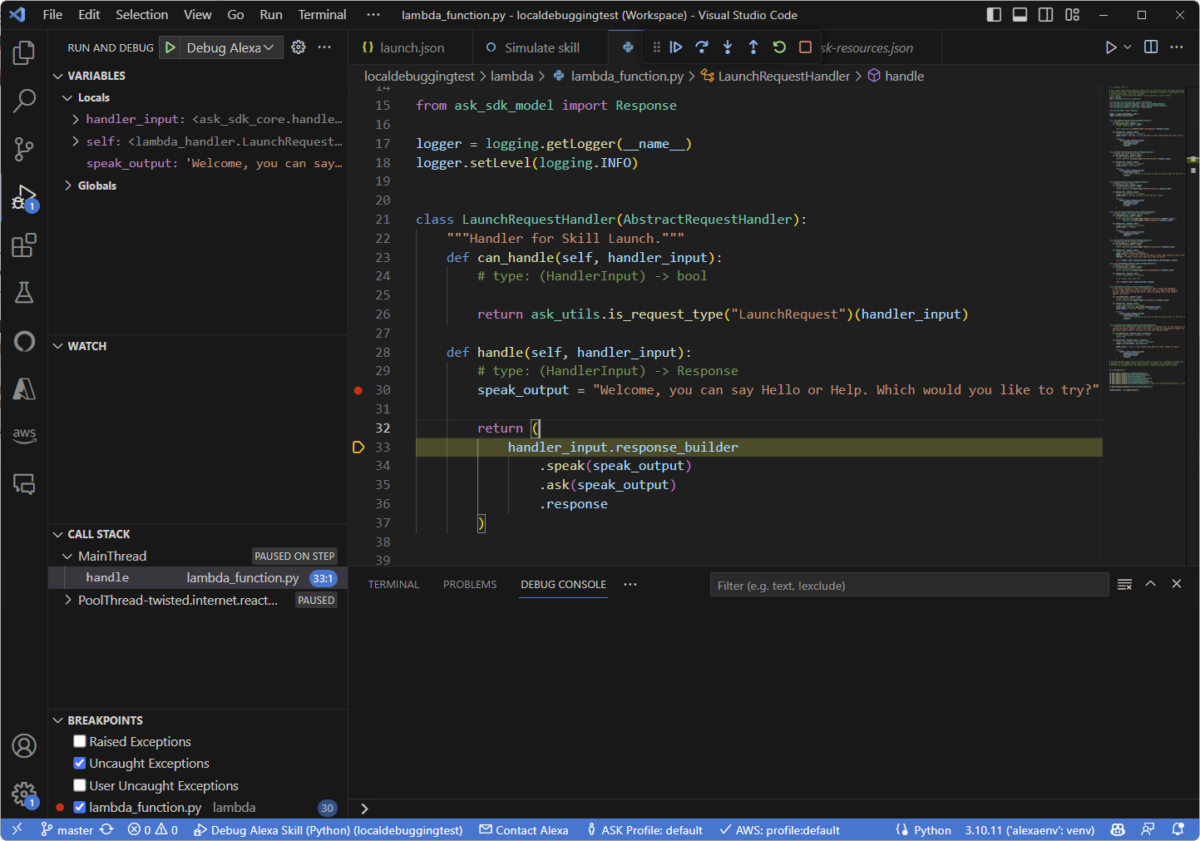
Finally: Local Debugging of Alexa Skills in VS Code
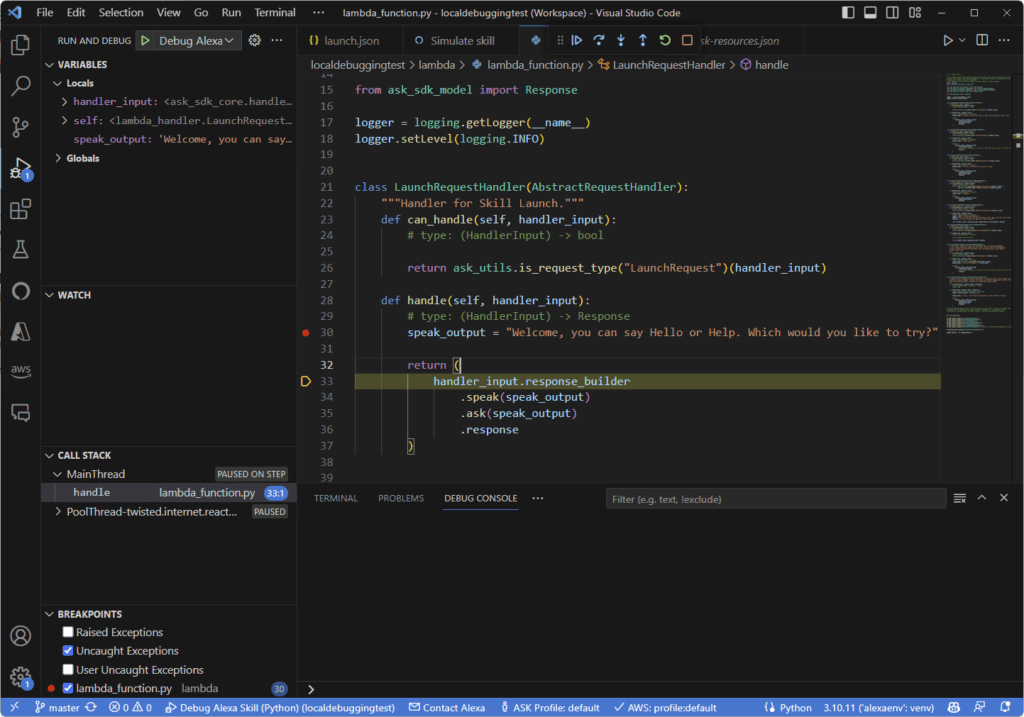
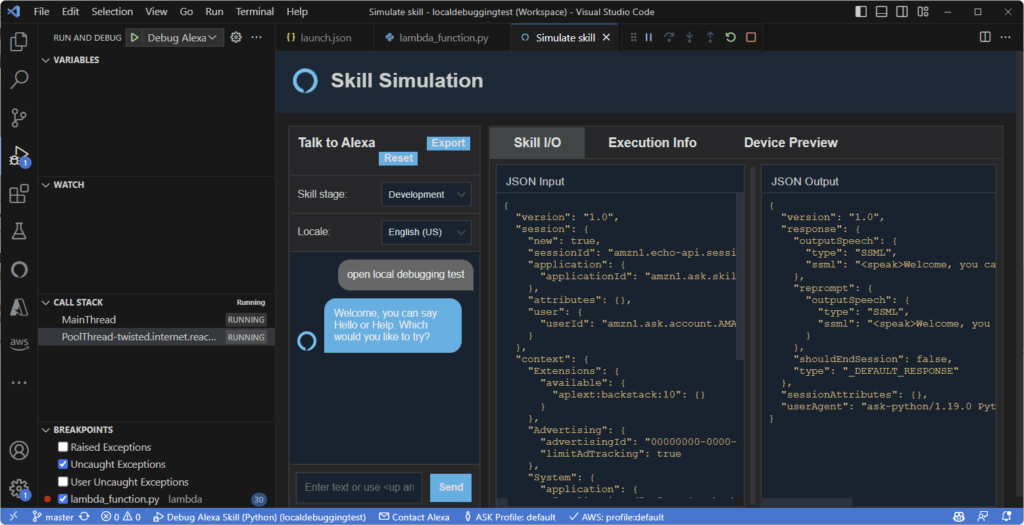
Once you’ve sorted out all the possible pitfalls and issues, you can finally start local debugging. In the “Run and Debug” view of Visual Studio Code, click on the green run button with the “Debug Alexa Skill (Python)” mode selected. A short while later, the debug controls appear on top of the file editor tabs. You can also set breakpoints in your code. A good first test is a breakpoint in the handle() function of the LaunchRequestHandler.
When you start local debugging, the requests from the Alexa backend are routed to your local machine instead of the Lambda function in the cloud. This is active for one hour, unless you stop debugging earlier. This means that you can debug no matter which device you use: the Alexa simulator within VS Code, the Amazon Alexa Console Test-Tab or even a real Echo device.
As soon as you launch your skill, it triggers your breakpoint. You can now step through the code and see all local variables.
Note that depending on the test device, it might only wait for a few seconds for the response of your backend. This means that if you take longer to step through your code, the Amazon Echo device could give up waiting and stop. But that doesn’t prevent you from debugging in detail how your backend handles the relevant request with your breakpoint(s).
Even though it is some work to set up, local debugging will save you a lot of time overall and is therefore worth it setting up right when you start developing your skill!
One reply on “Local Debugging of Alexa Skills with Visual Studio Code”
Hello Andreas, this article helped me a lot! Works like a charm now. Thanks for your effort in writing this detailed guide.