In a recent research project, we researched possibilities for interactive storytelling, usability, and interaction methods of an Augmented Reality app for patient education. We developed an ARCore app with Unity that helps patients with strabismus to better understand the processes of examinations and eye surgeries. Afterwards, we performed a 2-phase evaluation with a total of 24 test subjects.
We published the results at the IEEE VR conference. The peer-reviewed paper is available through the open access online proceedings or on ResearchGate.
A brief overview of the main findings:
Health Literacy and Education
Low health literacy is a well-known and serious issue. 1 in 5 American adults lack skills to fully understand implications of processes related to their health . Audio and computer-aided instructions can be helpful. Especially spoken instructions lead to a higher rate of understanding . A smartphone app that combines multiple approaches can therefore provide great benefits.
We developed and evaluated a prototype Augmented Reality (AR) mobile application called Enlightening Patients with Augmented Reality (EPAR). The app is designed for patient education about strabismus and the corresponding eye surgery. It is intended to be used in addition to the doctors’ mandatory consultations.
Interactive Storytelling
Together with a medical expert in the team, we identified the main points to convey to users about strabismus. The contents are divided into three chapters:
- Introduction: how are eye muscles set up? How do healthy eyes work and what happens if eyes are misaligned?
- Eye surgery: step-by-step explanation, namely: opening the conjunctiva, detaching the eye muscle, recession / resection of the eye muscle, and stitching.
- Post-operative care: information about the course of recovery and the healing process.
Interaction Design
We had two main goals: first, viewers should experience the story and at the same time receive the most relevant information. Second, users should be able to interact with the AR environment. We assumed that a higher level of interaction would affect the engagement with the topic of strabismus, based on findings from .
This is realized through an interaction triangle. After an initial information part, a fork in the story lets users choose their next action by repeating, further exploration or proceeding.

Three interaction prompt concepts made sense, which share the purpose of notifying and encouraging users that they should interact. Additionally, they should show possible areas of interaction in the augmented reality scene:
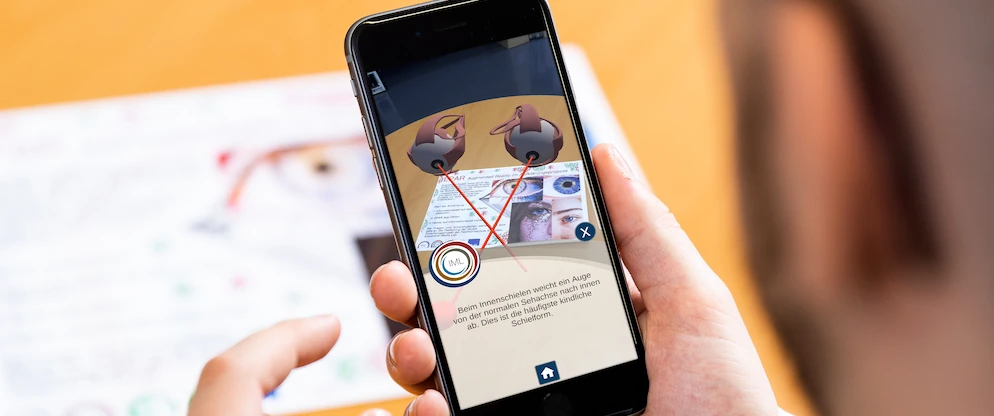
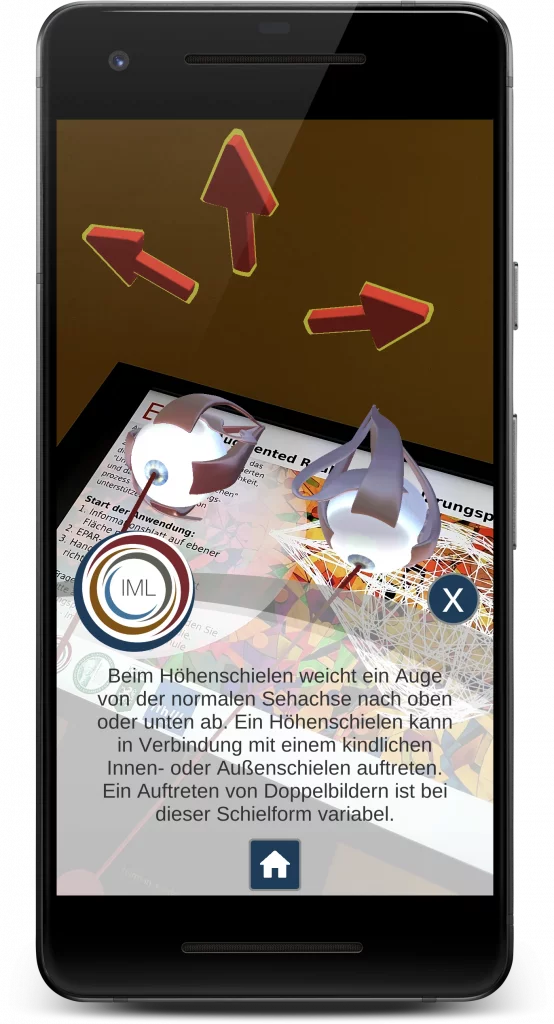
- Visual highlights: glowing and pulsating yellow border around parts of 3D models that users can tap on.
- Haptic feedback through vibration of the phone, synchronized to visual highlight.
- Auditive: notification sound.
After five seconds of user inactivity in a sequence where interaction is possible, the app triggers interaction prompts or combinations of them.
Technical Implementation
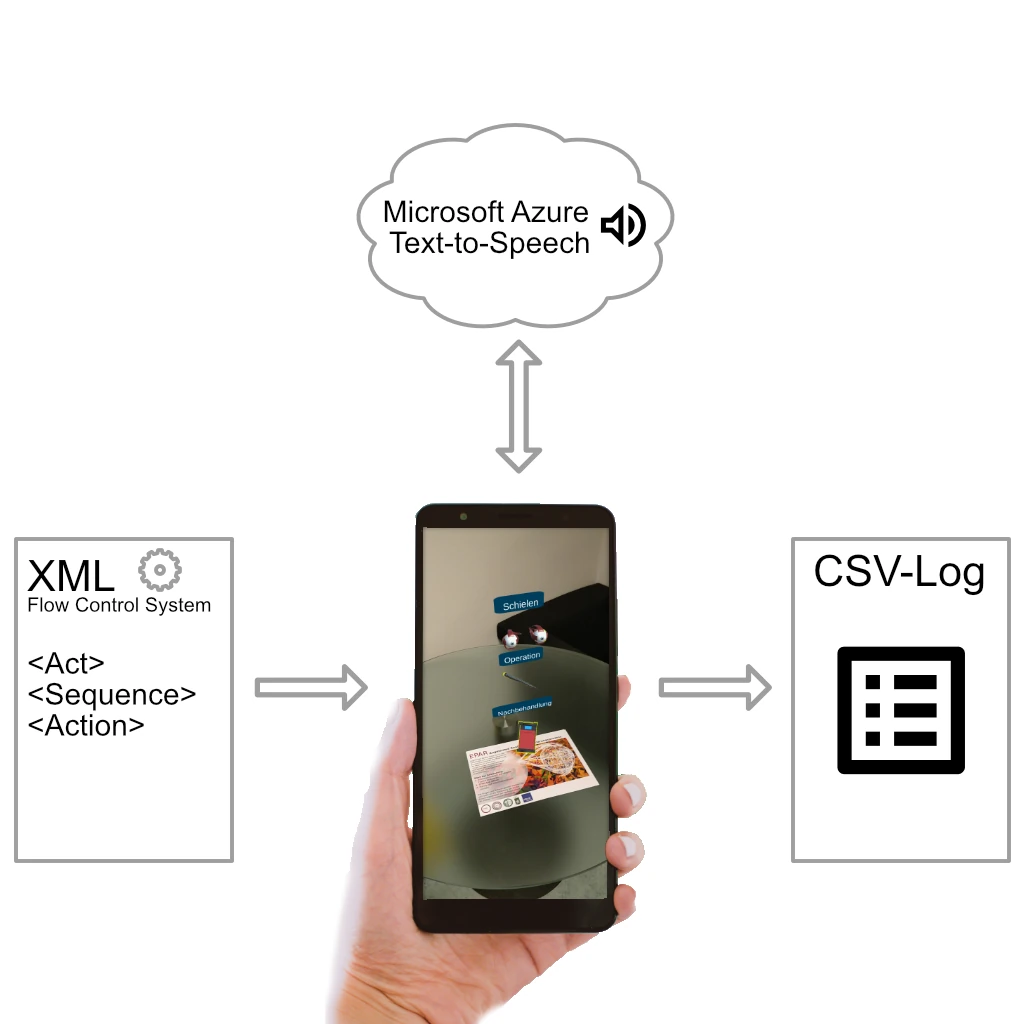
We built the prototype app with the Unity engine and Google ARCore. For placing digital objects in the real world, we designed paper target images (“markers”, “augmented images”). The position, rotation and scale of the virtual object is then tied to the paper sheet, which is handed out to users in the patient education use case. Our evaluation setup specifically required space for the user to physically walk around the table where the marker was placed, to allow a free choice of interaction style.
In addition, we developed an XML-based flow control system. It separates the story into acts, sequences, and actions. The app created log files to record user metrics for the evaluation. Each UI text element was transformed to voice through the neural voice service by Microsoft Azure, which is almost indistinguishable from humans . It also allowed for rapid prototyping and would help for future multi-lingual versions of the patient education app.
Visual Design and Content Creation
We had to design 3D models for explaining the concepts behind strabismus. Based on early user feedback to reduce fear and anxiety, we selected an abstract design style. This also helps avoiding the uncanny valley effect .
Patient Education Evaluation and Research Questions
We designed a two-stabe usability evaluation to answer the main research questions:
- Which interaction prompt (visual; visual & haptic; visual & haptic & auditive) seems comfortable and goal-oriented to the user? What difficulties and obstacles appeared?
- Does the three-dimensional augmentation of the content add subjective value for the user?
- Is it clear to the user how interactions with 3D objects modify the story?
First Stage Evaluation
Performed through a cognitive walkthrough to observe actions performed by users and measuring the relevant attributes. We invited six experts in the subject areas: AR, UI, and healthcare (3 male, 3 female; 2 from each subject area). They received representative tasks. Additionally, we encouraged participants to “think aloud” in a lab-like setup. We gathered qualitative and quantitative data, including the “System Usability Scale” (SUS).
We also used the results to revise the prototypical application. Especially the start / tracking procedure required attention, so that users could better understand how to target the tracking sheet with their smartphones to start the AR experience. Also, a 3D-style menu was unfamiliar to users, who often expect “burger-style” menus. It resulted in a median SUS-score of 67.5.
Second Stage Evaluation
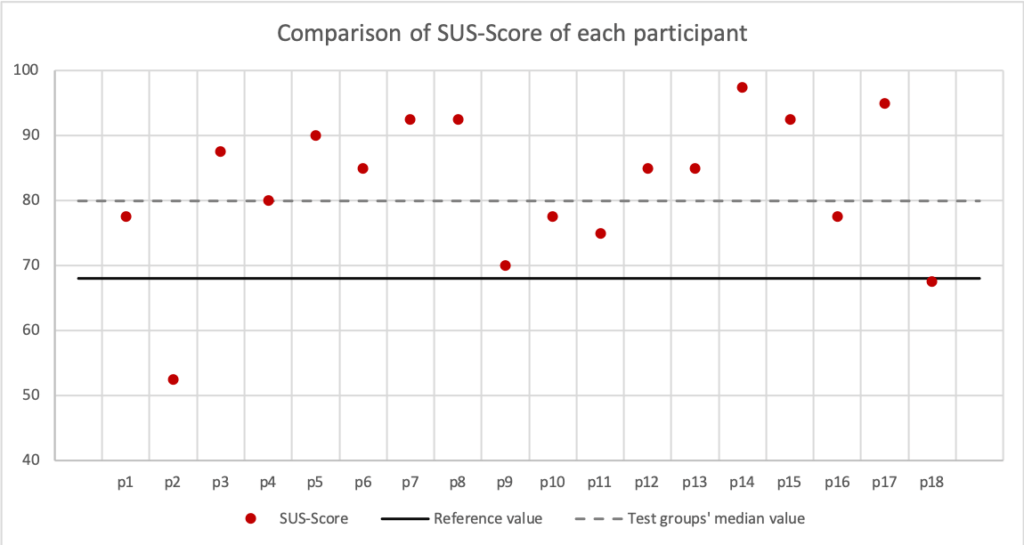
We recruited possible end users for this evaluation based on three personas with a different level of technical knowledge. The test group consisted of 18 participants (six per persona profile, 9 male, 9 female). The tasks were similar to the first stage evaluation but with a stronger focus on the various interaction prompts. Every user was administered all tasks, but the order changed.
Over all three groups, the prototype reached a median SUS-score of 80.0. The implemented improvements from the first stage evaluation proved to have a positive impact.
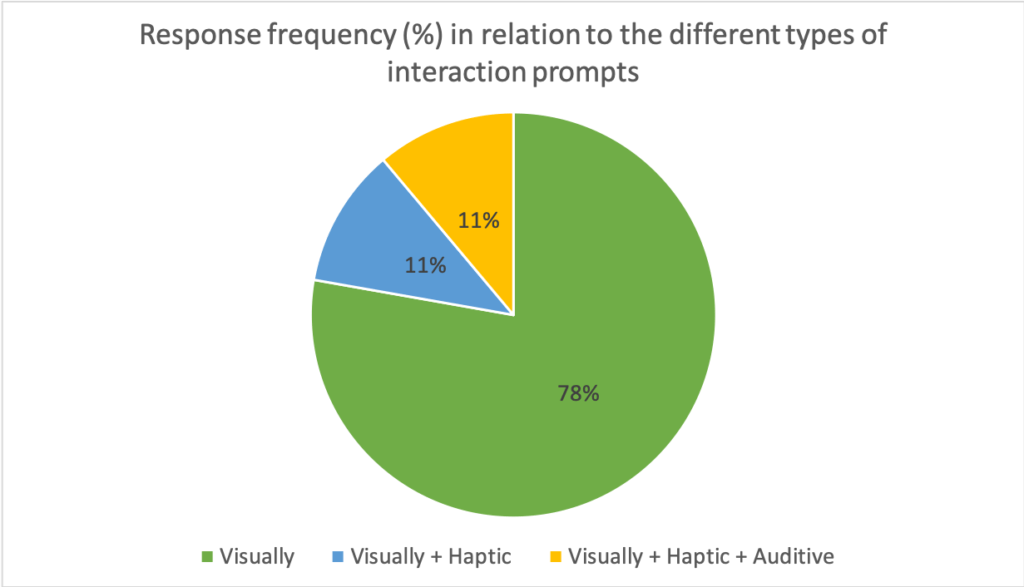
Research Question 1: Interaction Prompts
14 out of 18 found that a visual highlight is sufficient as interaction prompt. Some mentioned that an additional textual / spoken sentence such as “Click on the scalpel to get further information” would be beneficial.
Vibration was partly mentioned as annoying, or people mis-interpreted the phone vibration as an incoming call.
Also, only 2 out of 18 users liked the audio interaction prompt. Users mentioned that they felt stressed and confused, or even connected the vibration and sound with danger.
Research Question 2: Benefit auf AR
The results are very visible from specific questions of the post-test questionnaire. For example, “I think the 3D augmentation of the content is useful / reasonable and informative” achieved a median value of 4.5 (mean 4.4, 1 = do not agree at all, 5 = fully agree, n = 18).
Also, the question “I think the use of the application as a complementary tool can lead to a better understanding of the content of a medical consultation” was rated with a median of 5.0 (mean 4.4), suggesting great agreement to one of the overall goals of the prototype.
Research Question 3: How Interactions with 3D Objects Modify the Story
Both qualitative and quantitative measures were used. To test distinctive features of the app, users had to complete tasks. After each task, we conducted a short interview. An example: “You want to find out more about the different types of strabismus. What is the most common type of infant strabismus? How can you get this information?”.
Users described that they had a feeling of control over the system, and they knew how to interact with it (median 4.0, mean 4.2).
Conclusion
Overall, the total of 24 evaluation participants thought that an AR system as a complementary tool for medical patient education could lead to a better understanding, which is the basis for making a well-informed decision.
After the first iteration with improvements to the prototype usability, the 18 test persons based on patient personas with different technical knowledge rated the app with a median system usability score (SUS) of 80.0 (mean 82.2). On average for every single persona group, the median SUS-score was higher than the minimum value of 68 that is recommended in the literature .
The ultimate target group of patients that suffer from strabismus usually adopt one eye as their main eye; as such, their three-dimensional vision is impaired. They would not be able to use a head-mounted display. For smartphone-based AR, the display is still 2D. Therefore, we do not expect strabismus patients to have a different outcome when using a smartphone-based AR system compared to our test subjects based on personas.
Details and Patient Education Open Access Paper Download
For more details, download the peer-reviewed paper through the IEEE VR open access online proceedings or on ResearchGate.
Thanks to the core team members of this research project: Andreas Jakl, Anna-Maria Lienhart, Clemens Bauman, Arian Jalaeefar, Alexander Schlager, Lucas Schöffer, and Franziska Bruckner.
Our research was funded by the Austrian Ministry of Digital and Economic Affairs within the FFG COIN project Immersive Media Lab (866856).
Bibliography